Countries reported USD 128 million of licorice (liquorice) extract exports to UN Comtrade for 2024, a year for which Iran and the United Arab Emirates have not yet reported. Reported exports peaked at USD 219 million in 2013, leaving aside one outlying record for 2019. The United States led until 2014, Iran in 2015–2017, the United Arab Emirates in 2018 and France in 2019–2023; among the countries that have reported 2024, Uzbekistan, France and China were the largest. Uzbekistan has reported its trade only since 2017. This article sets out what the statistics show, and where they fall short.
Licorice extract has its own subheading in the Harmonized System (HS), the customs nomenclature most countries use: 1302.12, "saps and extracts of liquorice". The figures below are the values and weights that countries report under that subheading to the United Nations' trade database, UN Comtrade, from 2000 to 2025. Figures for 2024 and 2025 are still incomplete.
What HS 1302.12 covers
This article follows the extract, not the root, because the root has had no subheading of its own since 2007. The 2002 edition of the HS had one for liquorice roots, 1211.10; the 2007 edition dropped it, and the root is now recorded with other plants under 1211.90 (WCO, HS 2002; WCO, HS 2007).
Licorice extract is the part of the root that dissolves in boiling water. The US food rule defines it as "that portion of the licorice root that is, after maceration, extracted by boiling water", and says it is "sold as a liquid, paste ("block"), or spray-dried powder" (21 CFR 184.1408). Its characteristic constituent is glycyrrhizin, or glycyrrhizic acid: the EU's Scientific Committee on Food put it at 4–25 % of crude block extract (SCF 2003).
It takes several kilograms of root to make one of extract. The EU's contaminant regulation notes that "1 kg of extract is obtained from 3 to 4 kg of liquorice root" (Regulation (EU) 2023/915, Annex I, entry 1.2.19).
The same committee listed the products through which glycyrrhizinic acid reaches people: confectionery, beverages, chewing gum, toothpaste, medicinal products and tobacco. It noted that liquorice extract is added to tobacco products at up to 4 %.
Subheading 1302.12 covers extract as liquid, block or powder. Chemically defined glycyrrhizic acid and its salts, such as ammonium glycyrrhizate, are classified elsewhere, among the glycosides of heading 29.38 (the UK tariff, for example, has a line 2938 90 30 "Glycyrrhizic acid and glycyrrhizates": UK Trade Tariff, heading 2938). Even so, 1302.12 spans a wide range of products, so a tonne under this code can mean very different things.
Who exports licorice extract
Reported exports roughly tripled from USD 65 million in 2000 to a peak of USD 219 million in 2013. That peak leaves aside one outlying record for 2019 (see Gaps in the statistics). Exports have fallen since, to USD 128 million in 2024, a year that still lacks Iran and the United Arab Emirates. Reported weights were about 20,000 t in 2000 and 28,700 t in 2013, which suggests that most of the rise came from a higher price per tonne.
Reported exports peaked in 2013 and have fallen since. World totals reported to UN Comtrade, USD million, 2000–2024.
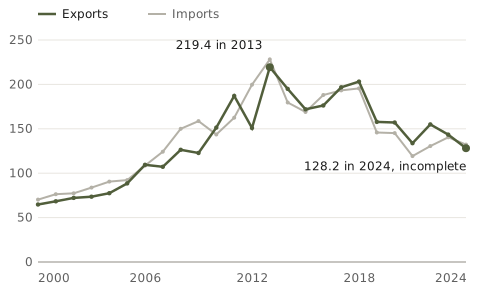
Source: UN Comtrade, HS 1302.12, all reporting countries, retrieved 26 October 2026. The 2019 export total leaves out the outlying Afghan record (USD 114.9 million).
The lead changed hands. The United States was the largest exporter every year from 2000 to 2014; its exports peaked at USD 58.1 million in 2012 and were USD 2.2 million in 2024. Iran led in 2015–2017, the United Arab Emirates in 2018, and France from 2019 to 2023. Among the countries that had reported 2024 by October 2026, Uzbekistan, France and China were the three largest. Germany's exports have stayed between USD 14 and 24 million a year since 2014.
The United States led until 2014; among 2024 reporters, Uzbekistan, France and China led. Exports by country, USD million, 2000–2024; the grey lines in each panel are the other five countries.
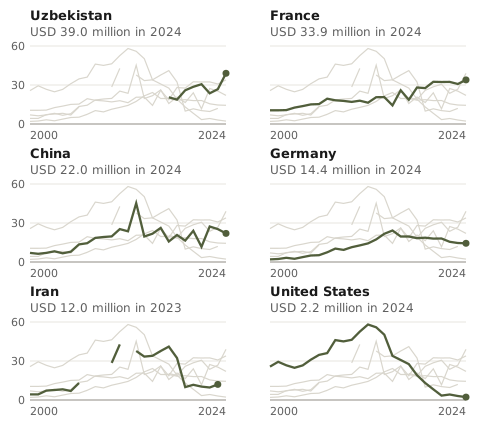
Source: UN Comtrade, HS 1302.12, values declared by the exporters, retrieved 26 October 2026. Gaps are years not reported: Iran reported nothing for 2007–2009, 2012 and 2024, and Uzbekistan's first report is for 2017.
The first figures for 2025 show France first among the countries that have reported, with USD 38.6 million; Uzbekistan, Iran and the United Arab Emirates have not yet reported 2025.
Who imports it
Four countries took 61 % of the value of reported imports in 2024: China, France, the United States and Germany. In all, 96 economies reported imports worth USD 132.2 million.
| Importer, 2024 | Value, USD million | Weight, t | USD per tonne |
|---|---|---|---|
| China | 26.6 | 6,399 | 4,157 |
| France | 18.1 | 3,422 | 5,284 |
| United States | 17.9 | 2,503 | 7,158 |
| Germany | 17.5 | 3,418 | 5,113 |
| Indonesia | 6.6 | 491 | 13,510 |
| Netherlands | 6.0 | 937 | 6,377 |
| Italy | 5.4 | 607 | 8,883 |
| Finland | 4.5 | 450 | 9,973 |
| Austria | 3.2 | 460 | 6,881 |
| United Kingdom | 3.0 | 264 | 11,554 |
Source: UN Comtrade, retrieved 26 October 2026. Importers mostly declare values at their own border, including freight and insurance; exporters declare them at theirs, free on board. That is one reason the import and export totals differ.
Each large importer draws on a different origin. In 2024 China took 84 % of its imports by value from Uzbekistan. Germany took 60 % from Iran and 28 % from France. The United States split its purchases between France (50 %) and China (47 %). France, itself the second-largest exporter that year, bought 40 % of its imports from Turkmenistan, 28 % from China and 26 % from Uzbekistan.
The order has changed over time. Germany was the largest importer every year from 2000 to 2015 and again in 2019–2021, reaching USD 47.2 million in 2013. China imported only 57 t in 2000; it reached 8,954 t in 2012 and 6,399 t in 2024. Prices per tonne differ widely: China paid about USD 4,200 a tonne in 2024, Indonesia about USD 13,500. A low price fits crude extract bought for further processing and a high one finished or purified products; the statistics do not say which.
Uzbekistan's extract exports
Uzbekistan has reported its extract exports to UN Comtrade since 2017. For 2024 it reported USD 39.0 million for 8,656 t, the largest value among the 49 countries that had reported that year by 26 October 2026. Iran and the United Arab Emirates had not yet reported 2024, and Uzbekistan had not yet reported 2025. Its yearly figures since 2017 are in the exporters chart above.
Nearly all of it goes to China: 89 % of the value in both 2023 and 2024, with most of the rest going to France. The declared price was about USD 4,100–4,500 a tonne in 2022–2024. Prices per tonne are not comparable between exporters, because one code covers everything from crude block to refined grades.
Uzbek and Chinese records of the same trade disagree. For 2023 Uzbekistan declared 5,189 t exported to China; China declared 2,128 t imported from Uzbekistan. For 2024 the figures are closer: 7,310 t against 5,503 t. Gaps of this kind are common in these statistics (see Records that do not match).
Uzbek government decisions have favoured processing the root at home over exporting it raw. A 2013 Cabinet resolution, repealed in 2014, set a fee of USD 225 a tonne for a permit to export raw root, against USD 100 a tonne for exporting the processed product (Resolution No. 61 of 2013). In 2019 the government ended the payment privileges it had granted for exporting raw licorice, and set targets of 5,000 ha of new plantations a year in Karakalpakstan for 2019–2023 (Resolution No. 138 of 2019). A 2022 presidential resolution assigns licorice to every district of Karakalpakstan and of Khorezm region under its "one district, one product" programme (Resolution PP-251 of 2022). None of the acts read for this article bans the export of raw root.
Where licorice grows in Uzbekistan, and the state of its wild stands, is covered in our article Licorice (Glycyrrhiza): botany, distribution and ecology.
Gaps in the statistics
The statistics record what customs offices declare, and several gaps follow from that.
- Countries that do not report. Turkmenistan has reported its extract exports only once, for 2000. Its partners declared USD 24.7 million and 5,441 t of extract from Turkmenistan in 2023 (as valued by the importers), which would rank it fourth among that year's exporters. Iran returned no records for 2007–2009, 2012, 2024 and 2025, and the United Arab Emirates none for 2024 and 2025.
- Records that do not match. In 2023 Iran declared 2,584 t exported to the United Arab Emirates. The Emirates' own import records give Turkmenistan and Uzbekistan as the origin of 2,980 t of their 3,119 t, and almost nothing from Iran. Goods in transit can be recorded differently by the two sides, and timing can add to the difference; the data do not say which applies here, or in the Uzbek–Chinese gap above.
- One code, many products. Japan exported 30–44 t a year in 2022–2024 at USD 62,000–73,000 a tonne, against USD 2,000–9,000 for the bulk exporters. Such prices fit highly refined grades rather than crude extract, but the code does not separate them.
- An outlying record. For 2019 Afghanistan reported exports of USD 114.9 million for 2,351 t, about USD 48,900 a tonne. Prices that high appear elsewhere only for small lots, at most about 50 t a year, such as Japan's, and no importer reports anything near this quantity from Afghanistan. With the record, world exports in 2019 would be about USD 272.7 million; without it, about USD 157.8 million. The charts leave it out.
- Missing weights. France, the largest exporter in 2019–2023, gave no weight for its exports in 2021, 2023 and 2024, so world tonnages for those years are too low.
- Counting twice. France, Germany and the Netherlands are among the largest importers and also among the largest exporters. Where they re-export imported extract, refined or not, it is counted twice, so world totals probably overstate the extract actually produced.
All values are in current US dollars, not adjusted for inflation.
Sources
The trade figures come from the UN Comtrade public API: commodity 130212, annual data, classification "HS as reported", every reporting country, partner "World", exports and imports, 2000–2025, one call per year and flow (example call). Country-by-partner figures come from the same API with one named reporter. World totals are sums over reporting economies, with no regional aggregate such as the EU added. Value is the declared trade value in current US dollars; weight is the net weight, or the alternative quantity in kilograms where the net weight is missing. Prices per tonne are value divided by weight. The figures were retrieved on 26 October 2026; those for Turkmenistan as an origin and for the Iran–Emirates trade, which are what partner countries declared, were retrieved on 11 October 2026 and checked again on 26 October. Comtrade revises its data as countries report, so later figures may differ, especially for 2024 and 2025.
- United Nations Statistics Division. UN Comtrade database, HS 1302.12. comtradeplus.un.org
- World Bank. WITS: liquorice sap and extract exports by country, 2023 (used to cross-check the 2023 exporter figures). wits.worldbank.org
- World Customs Organization. Harmonized System, heading 12.11, 2002 edition and 2007 edition.
- UK Trade Tariff. Heading 2938, glycosides. trade-tariff.service.gov.uk
- US Code of Federal Regulations. 21 CFR 184.1408, Licorice and licorice derivatives, paragraph (a). ecfr.gov
- European Union. Regulation (EU) 2023/915 on maximum levels for certain contaminants in food, Annex I, entry 1.2.19. eur-lex.europa.eu
- EU Scientific Committee on Food (2003). Opinion on glycyrrhizinic acid and its ammonium salt. food.ec.europa.eu
- Cabinet of Ministers of the Republic of Uzbekistan. Resolution No. 61 of 1 March 2013 (no longer in force since 27 October 2014), lex.uz; Resolution No. 138 of 15 February 2019, lex.uz.
- President of the Republic of Uzbekistan. Resolution No. PP-251 of 20 May 2022, Appendix 2. lex.uz